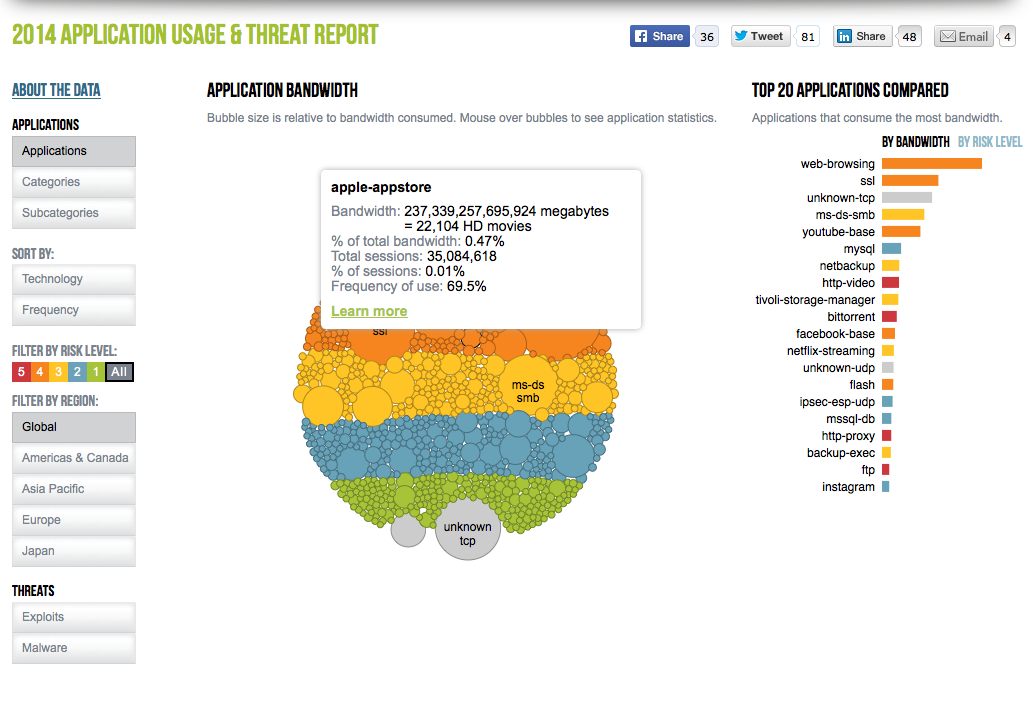
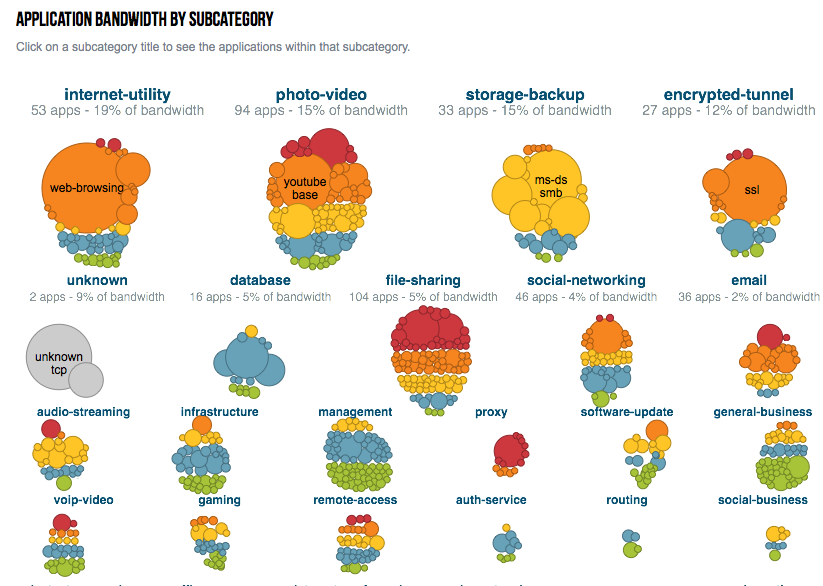
We worked with Palo Alto Networks to create an interactive tool for examining application usage and threats over networks. Built with d3.js, the visual tool characterizes network traffic from over 5,000 assessments performed worldwide over one year’s time. The objective was to show which applications were eating up the most bandwidth and represented the highest risk. Applications can be sorted by category and subcategory, and filtered by region or risk.
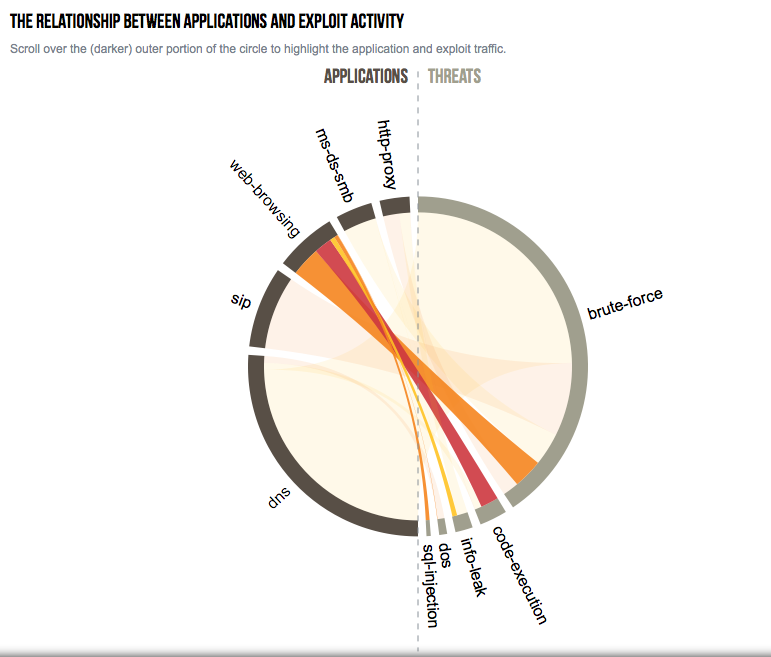
Another part of the tool connects specific types of exploits and malware threats (on the right) with the applications that deliver them (on the left).

The final version of the tool is no longer publicly accessible, but you can see an earlier iteration of the here:
Application Usage & Threat Report, 2013