Workforce Diversity: If not in tech, then where?
My work examining diversity in the tech workforce (on my own and for Wired Magazine) eventually led me to this question: If the tech workforce doesn't reflect the ethnic diversity of the general population, are there any industries that do?
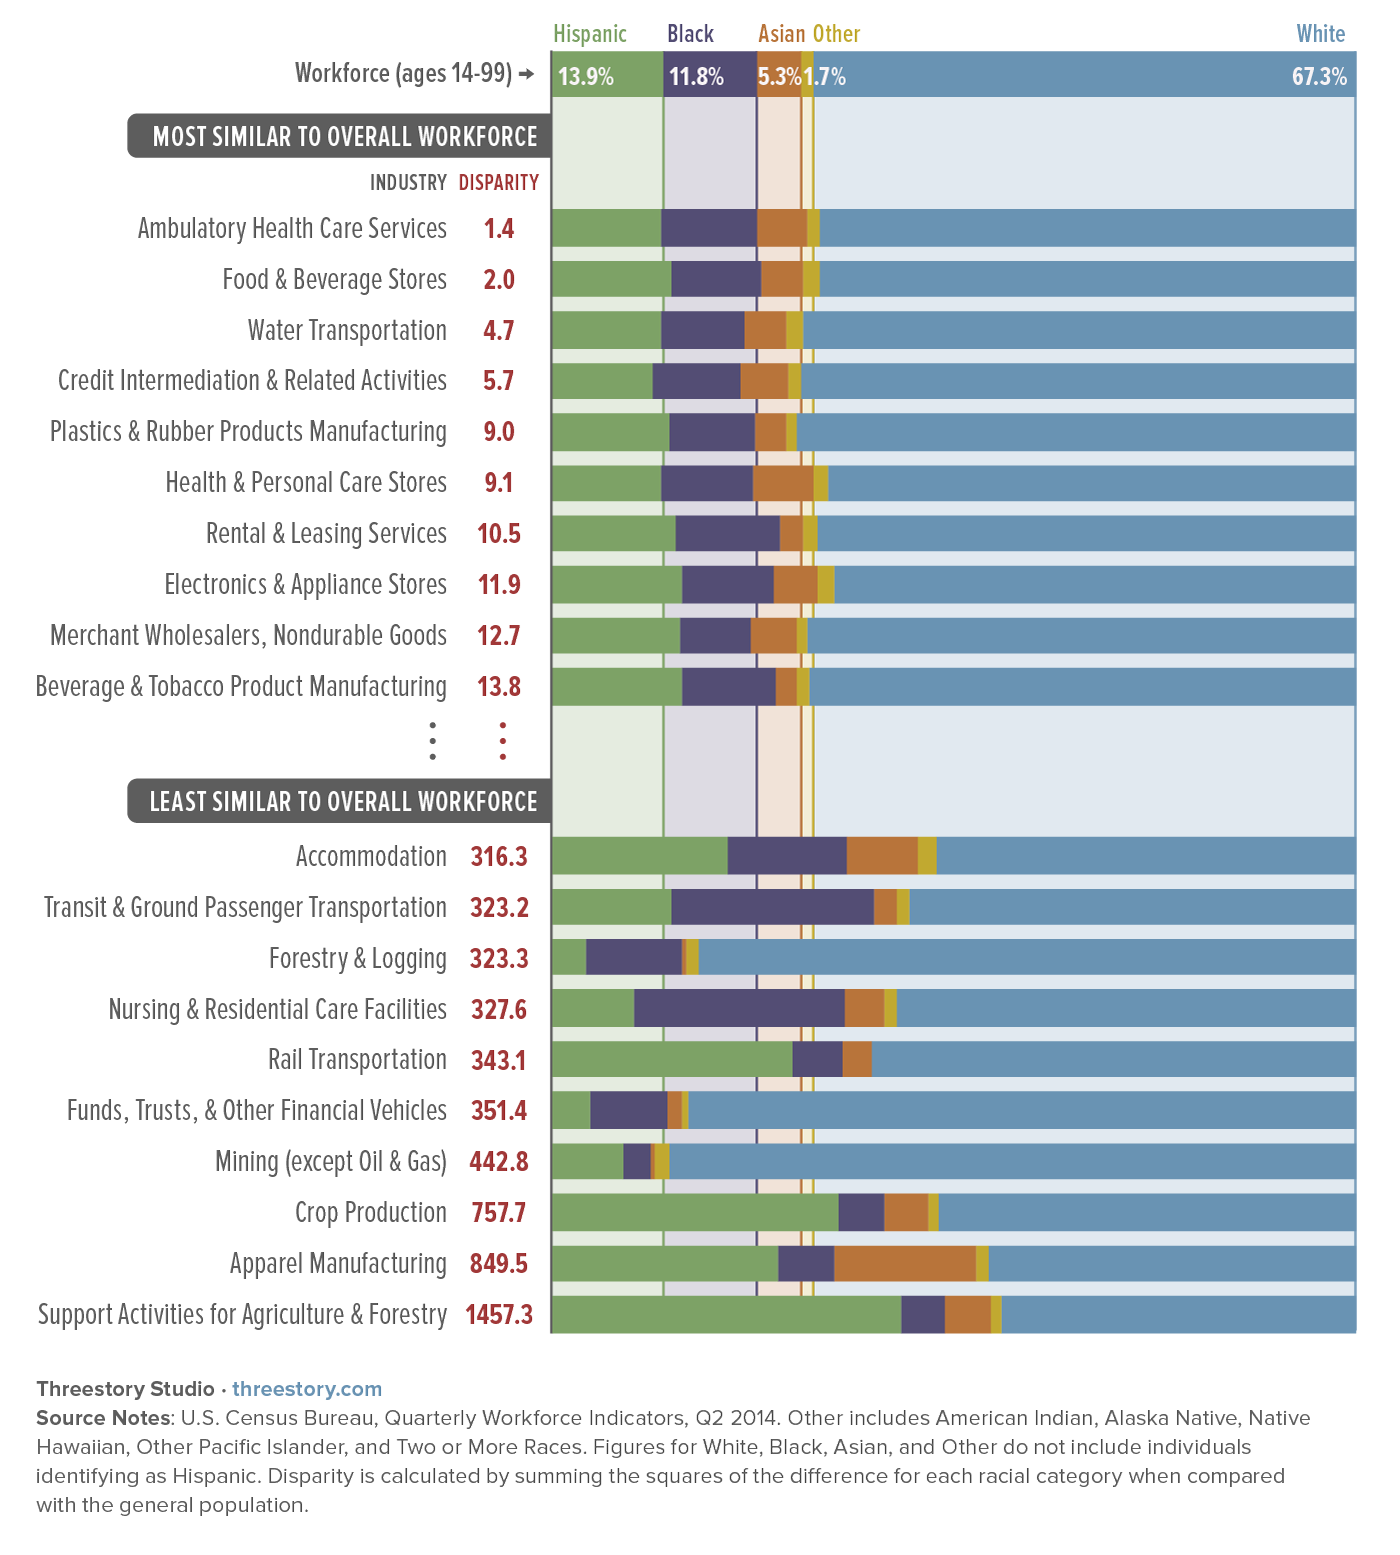
I like answerable questions. The employment data was available from the U.S. Census Bureau as part of their Quarterly Workforce Indicators. I grabbed the data and did some analysis, calculating a parity index by comparing the percent of workers in industry by race/ethnicity with the percent in the overall workforce. The lower the score, the more close the match with the general population (more details below). So, which was the closest match out of the 95 industry categories? Ambulatory Health Care Services.
It appears that many of the industries that are most representative of the population are a combination of universal need and hyperlocal focus. Food and beverage stores are everywhere, for example, and the people that work in them tend to live close by – so they might naturally be reflective of the community.
Some of the industries with the highest disparity scores, on the other hand, are geographically concentrated in specific parts of the country (agriculture, forestry, mining).
Those are just my first thoughts on seeing the data. They are just conjecture and I'm sure there are many other factors at work here. Send me a note if you have an interpretation to share.
Trying out Tableau
I ventured into Tableau Public for the first time to see if I could easily create an interactive version of the data, allowing you to see all 95 industries and inviting a little more exploration. Here's the result: Racial Parity by Industry Subcategory. I didn't get it to do everything I wanted, but I can see that Tableau has a lot of potential.
Methodology
To come up with a parity/disparity score for each industry, I took the sum of the squares of the differences between each ethnicity's representation in the industry vs. the population at large. The lower the score, the more similar the industry is to the ethnic makeup of the overall workforce. The higher the score, the more dissimilar. The Crop Production industry calculation to illustrate:
| Hispanic | Black | Asian | Other | White | Score | |
| Workforce % | 13.9 | 11.8 | 5.3 | 1.6 | 67.3 | |
| Crop Production % | 35.8 | 5.6 | 5.4 | 1.4 | 51.8 | |
| Difference | -21.9 | 6.2 | -0.1 | 0.2 | 15.5 | |
| Difference Squared | 479.3 | 38.2 | 0 | 0.1 | 240.2 | 757.7 |
Many thanks to Christopher Palmer at U.C. Berkeley for prompting the question, and for good advice and input on the data analysis.